Skip to content
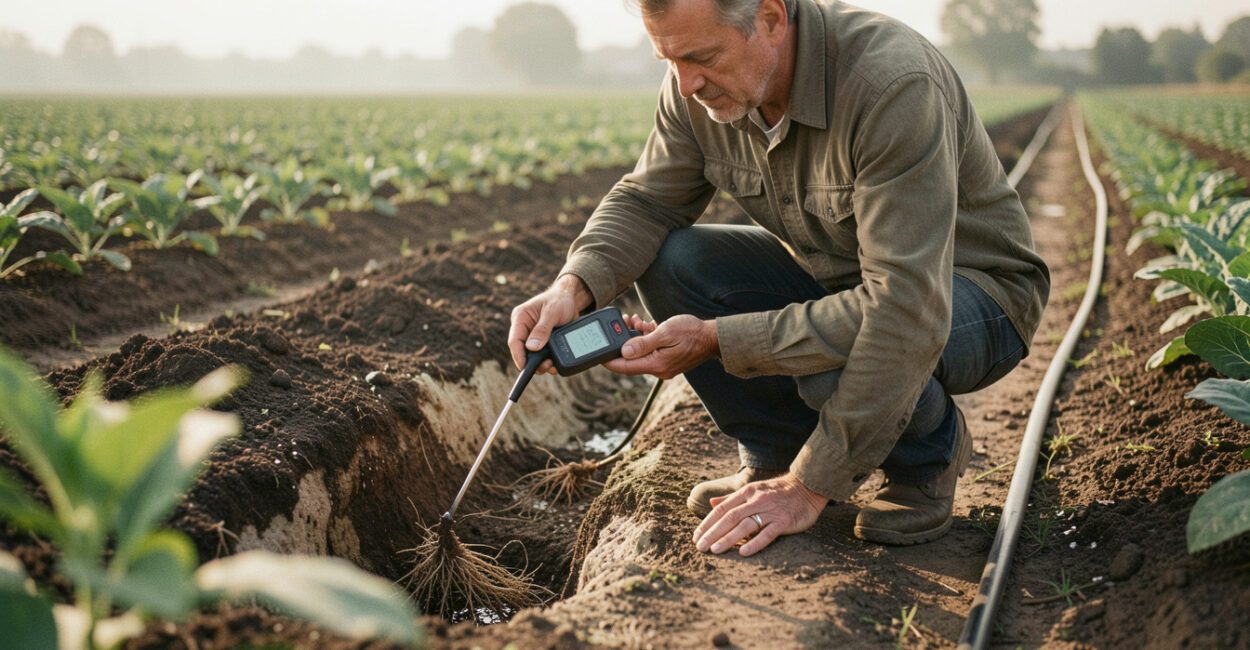
Reading Soil Moisture Data: Turning Numbers into Action
A sensor can show a wetter root zone after irrigation while a deeper sensor barely moves. That difference is useful: it can reveal how far water traveled. Soil moisture data helps growers track changing water conditions and refine irrigation timing, but a single reading cannot account for sensor placement, soil type, crop stage, or weather.
The dependable approach is to read a sensor over time, compare depths and locations, and check surprising changes against field conditions. A trend can support an irrigation decision; it cannot make one on its own.
Quick Facts
- Common measurement: Volumetric water content, or the volume of water in a given volume of soil.
- Another measurement: Soil water tension, which indicates how strongly water is held by the soil.
- Useful comparison: Readings at multiple depths in the active root zone.
- Key limitation: Readings depend on sensor type, soil, installation, and placement.
- Decision basis: Sensor trends combined with crop needs, weather, and field checks.
What Soil Moisture Data Measures—and What It Doesn’t
Soil moisture data describes the amount of water in soil or the energy plants need to extract it, depending on the sensor. Readings become useful when tracked over time and interpreted alongside soil type, root depth, crop stage, and recent weather. A number alone cannot establish whether a field needs irrigation.
Many probes report volumetric water content (VWC), the volume of water per volume of soil, often shown as a percentage. Tensiometers and some other instruments report soil water tension: the force required for roots to draw water from the soil. These measurements describe related but different properties, so their scales and thresholds are not interchangeable.
Sensor technology also matters. Capacitance and time-domain reflectometry (TDR) probes estimate water content from electrical properties, while tensiometers measure tension. The USDA Natural Resources Conservation Service’s soil quality indicators provide useful background on soil properties that influence water availability. The right interpretation still depends on the instrument and the field.
A moisture reading becomes useful when its direction, depth, and field context agree.
How to Read Soil Moisture Trends over Time
Start with a baseline from a correctly installed sensor, then watch how readings change before and after rain or irrigation. A gradual decline during dry weather may reflect crop water use; a rise after watering suggests that the sensor’s surrounding soil became wetter. The size and timing of each change matter, but so does whether the pattern repeats under similar conditions.
Make notes alongside the sensor record: rainfall, irrigation start and stop times, crop stage, and unusual conditions such as a heat wave. These details help explain why a reading moved. For example, a sensor may respond quickly after a short irrigation while a deeper probe changes later, as water moves through the profile.
Review the baseline whenever the crop, root zone, or management changes. A pattern that worked during early growth may not describe water use once roots extend deeper. For broader context on how monitoring fits into a water-management program, see this overview of smart irrigation systems in farming.
Complete guide: Soil Sensors for Small Farms: Cut Irrigation Costs

Why Readings Differ Across Depths and Locations
Water does not move evenly through every soil layer or field zone. Texture, compaction, slope, drainage, and irrigation coverage can all affect where water collects and how quickly it reaches a sensor. A sandy layer may drain sooner than a finer-textured layer, while compacted soil can slow infiltration or redirect flow.
Depth provides a view of movement through the root zone. A shallow sensor may respond quickly to irrigation or light rain; a deeper one can indicate whether water has reached lower roots or is moving beyond the main uptake zone. Placement matters just as much: a probe beside a drip emitter may read wetter than one between rows.
Use readings from representative management zones rather than assuming one installation describes an entire field. The role of precision irrigation software is easier to assess when sensor locations and field zones are mapped and documented.
How to Spot Unreliable Moisture Readings
A sudden jump or drop deserves a check before it prompts a change in irrigation. Compare it with nearby sensors, recent rainfall or watering, and the instrument’s previous pattern. A reading that changes sharply without a plausible field event may point to a data or installation problem.
- Check installation: Poor contact between the probe and soil can distort readings. Air gaps, disturbed soil, or a loose connection are common causes.
- Check placement: Confirm that the sensor remains at its recorded depth and has not shifted, been damaged, or ended up beside a localized water source.
- Check the system: Look for low power, communication gaps, time-stamp errors, or a sensor that repeatedly reports an identical value.
- Check calibration: Compare readings with the manufacturer’s guidance and, where needed, field-specific calibration or a trusted reference method.
Sensor accuracy is not a fixed property independent of soil. Some instruments respond differently across textures or salinity levels, and calibration in one soil may not transfer well to another. If a measurement conflicts with field observations, verify the probe and its setup before treating the number as representative.
Connect Sensor Readings to Irrigation Decisions
Use sensor trends as one input in a decision that also considers crop demand, root depth, forecast weather, and irrigation capacity. A drying trend in the active root zone may justify closer monitoring or irrigation planning; a recent rise at multiple depths may suggest that water has reached farther down. Neither pattern automatically dictates a schedule.
Thresholds must be set for the crop, soil, sensor, and management goal. The same VWC value can represent different conditions in different soils, while a tension reading follows a different scale altogether. Extension guidance, field trials, and local agronomic recommendations can help establish useful operating ranges. The FAO’s CROPWAT resource offers a framework for considering crop water requirements and irrigation planning, but it does not replace local sensor calibration or field judgment.
After irrigation or rainfall, allow for the sensor’s response time and the movement of water through the soil. Compare shallow and deep readings before deciding whether the application was sufficient. If only the shallow probe responds, water may not yet have reached deeper roots, or the deeper sensor may sit outside the wetting zone.
Practical Examples: From Readings to Next Steps
Example 1: A shallow probe rises after irrigation, but a deeper probe stays steady. Check whether enough time has passed for water to move downward, then inspect soil near the sensors. If the deep reading remains unchanged after an appropriate interval, review irrigation duration, emitter flow, and probe placement before extending the next application.
Example 2: One sensor drops sharply while nearby probes remain stable. Check the sensor’s connection, installation, and local soil conditions. If the reading cannot be confirmed, set it aside temporarily and avoid basing a field-wide irrigation decision on that point alone.
Example 3: Several depths rise after a storm. Record the response and compare it with rainfall and drainage conditions. If deeper layers stay wet, account for that stored water when planning the next irrigation rather than returning automatically to the previous schedule.
Build a Consistent Monitoring Routine
Choose representative locations, record each probe’s depth and position, and keep sensor data aligned with rainfall and irrigation records. Review trends on a consistent schedule, with extra checks after installation, maintenance, or a major weather event. A short field inspection can resolve questions that a graph cannot.
For each decision, note what the sensors indicated, what the field looked like, and what action followed. Over time, those records help reveal how a particular soil and irrigation setup respond. To connect monitoring with equipment costs and water savings, compare your results with this discussion of precision irrigation payback. Test your current approach against a few weeks of readings, then adjust only when the trend and field evidence support the change.
Should One Sensor Reading Determine When I Irrigate?
No. Confirm the trend against other depths or nearby sensors, and consider crop demand, weather, and field conditions before acting.
Why Might a Reading Change After Rain but Not After Irrigation?
The water may not have reached the probe, or the sensor may sit outside the irrigated wetting pattern. Rain can also cover a wider area than a localized irrigation system. Check timing, placement, and the readings at other depths before drawing a conclusion.
Can I Compare Moisture Readings from Different Sensor Brands?
Only with care. Different instruments may measure different properties, use different scales, or respond differently to soil conditions. Confirm whether each reports water content or tension, and follow the manufacturer’s guidance before comparing values or applying a shared threshold.